
This report summarizes U.S. Immigration and Customs Enforcement’s (ICE) Enforcement and Removal Operations’ (ERO) Fiscal Year (FY) 2015 removal activities. ICE shares responsibility for enforcing the Nation’s immigration laws with U.S. Customs and Border Protection (CBP) and U.S. Citizenship and Immigration Services (USCIS). In executing its enforcement duties, ICE focuses on two core missions: 1) the identification and apprehension of criminal aliens and other priority aliens located in the United States; and 2) the detention and removal of those individuals apprehended in the interior of the United States as well as those apprehended by CBP officers and agents patrolling our nation's borders. ICE is committed to smart immigration enforcement, preventing terrorism, and combatting the illegal movement of people and goods.
This report analyzes ICE’s FY 2015 ERO removal statistics to demonstrate how the Department of Homeland Security’s (DHS) enforcement priorities positively impact our communities. In executing these responsibilities, ICE has prioritized its limited resources on the identification and removal of threats to national security, border security, and public safety, as outlined in Secretary of Homeland Security Jeh Johnson’s November 20, 2014 memorandum entitled Policies for the Apprehension, Detention, and Removal of Undocumented Immigrants.
The nature and scope of ICE’s civil immigration enforcement is impacted by a number of factors, including: 1) the level of cooperation from state and local law enforcement partners; 2) the level of illegal migration 1; and 3) changing migrant demographics.
The Department’s clearer and more refined civil immigration enforcement priorities, which ICE began implementing in FY 2015, placed increased emphasis and focus on the removal of convicted felons and other public safety threats over non-criminals. To further build on the prioritization of convicted criminals and enlist the support of the many state and local jurisdictions that were not cooperating with ICE, DHS ended Secure Communities and replaced it with the Priority Enforcement Program (PEP). With the implementation of PEP, which became fully operational in July 2015, ICE has engaged in expansive efforts to encourage state and local law enforcement partners to collaborate with ICE to ensure the transfer and removal of serious public safety threats.
Because of the many factors described above, there were fewer removals in FY 2015 than there were in FY 2014. More detailed statistics contained in this report also show that an increased percentage of those removals involve convicted criminals and other priorities as a result of ICE’s targeted focus on the most significant threats to national security, public safety, and border security.2 Indeed, 98 percent of individuals that ICE removed in FY 2015 met ICE’s civil immigration enforcement priorities. As these new enforcement priorities continue to take hold, and state and local cooperation increases, ICE expects continued progress in ensuring its resources are appropriately focused in keeping our Nation safe and secure.
Figure 1
Removals Overview
- ICE conducted 235,413 removals.
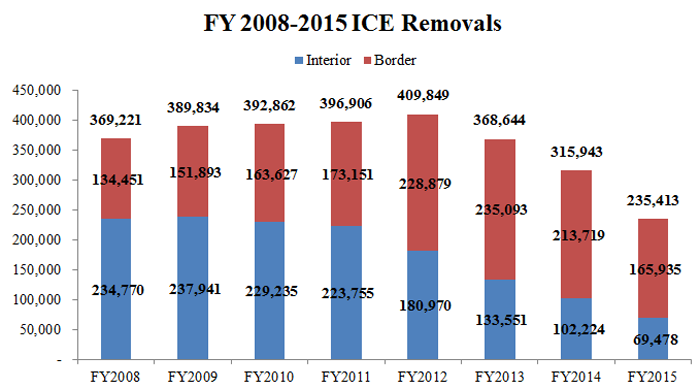
- ICE conducted 69,478 removals of individuals apprehended by ICE officers (i.e., interior removals) (Figure 2).
- 63,539 (91%) of all interior removals were previously convicted of a crime.
- ICE conducted 165,935 removals of individuals apprehended at or near the border or ports of entry.3
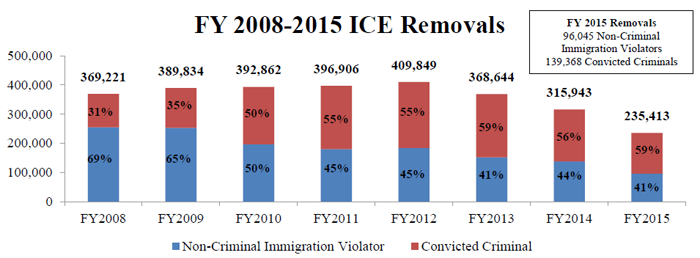
- 59% of all ICE removals, or 139,368, were previously convicted of a crime.
- ICE conducted 63,539 interior criminal removals.
- ICE removed 75,829 criminals apprehended at or near the border or ports of entry.
- 98 percent of all ICE FY 2015 removals, or 230,715, met one or more of ICE’s stated civil immigration enforcement priorities.4
- Of the 96,045 individuals removed who had no criminal conviction, 94 percent, or 90,106, were apprehended at or near the border or ports of entry.5
- The leading countries of origin for removals were Mexico, Guatemala, Honduras, and El Salvador.
- 1,040 individuals removed by ICE were classified as suspected or confirmed gang members.6
Figure 2
Conclusion
Over the course of FY 2015, ICE has improved its ability to target individuals who threaten public safety and national security as demonstrated by the fact that 98 percent of individuals that ICE removed met ICE’s civil immigration enforcement priorities. As these revised enforcement priorities continue to take hold, and state and local cooperation increases, ICE expects continued progress in ensuring its resources are appropriately focused in keeping our nation safe and secure.
Definitions of Key Terms
Arrest: An arrest, also called an apprehension, is defined as the “act of detaining an individual by legal authority based on an alleged violation of the law.”
Border Removal: An individual removed by ICE who is apprehended by a CBP officer or agent while attempting to illicitly enter the United States at or between the ports of entry. These individuals are also referred to as recent border crossers.
Convicted Criminal: An individual convicted in the United States for one or more criminal offenses. This does not include civil traffic offenses.
Immigration Fugitives: An individual who has failed to leave the United States based on a final order of removal, deportation, or exclusion, or has failed to report to ICE after receiving notice to do so.
Intake: An intake is the first book-in into an ICE detention facility associated with a unique detention stay. This does not include transfers between ICE facilities.
Interior Removal: An individual removed by ICE who is identified or apprehended in the United States by an ICE officer or agent. This category excludes those apprehended at the immediate border while attempting to unlawfully enter the United States.
Other Removable Alien: An individual who is not a confirmed convicted criminal, recent border crosser, or other ICE civil enforcement priority category. This category may include individuals removed on national security grounds or for general immigration violations.
Previously Removed Alien: An individual previously removed or returned who has re-entered the country illegally.
Reinstatement of prior Removal Order: The removal of an alien based on the reinstatement of a prior removal order where the alien departed the United States under an order of removal and illegally re-entered the United States (INA § 241(a)(5)). The alien may be removed without a hearing before an immigration court.
Removal: The compulsory and confirmed movement of an inadmissible or deportable alien out of the United States based on an order of removal. An individual who is removed may have administrative or criminal consequences placed on subsequent re-entry because of the removal.
1 As measured by the number of apprehensions by CBP. | return to text
3 Approximately 94 percent of these individuals were apprehended by U.S. Border Patrol agents and then processed, detained, and removed by ICE. The remaining individuals were apprehended by CBP officers at ports of entry. | return to text
4 As defined in the November 20, 2014 DHS memorandum, Policies for the Apprehension, Detention and Removal of Undocumented Immigrants Memorandum | return to text
5 ICE defines criminality via a recorded criminal conviction obtained by ICE officers and agents from certified criminal history repositories. The individuals described above include recent border crossers, fugitives from the immigration courts, and repeat immigration violators. | return to text
6 Gang affiliation is documented based upon alert codes entered by a deportation officer. | return to text
Impact
Impact of Civil Immigration Enforcement Priorities
FY 2015 marked a major progression period in which ICE implemented revised Department-wide civil immigration enforcement priorities, as directed by DHS Secretary Johnson in his November 20, 2014 Memorandum, Policies for the Apprehension, Detention, and Removal of Undocumented Immigrants, known as the Civil Immigration Enforcement Priorities (CIEP). The revised priorities have intensified ICE’s focus on removing individuals convicted of serious crimes and public safety and national security threats, as well as recent border entrants.
More specifically, DHS’ newly defined priorities established three civil immigration enforcement categories, in descending order of priority. These priorities are: 1) national security threats, convicted felons or “aggravated felons,” active criminal gang participants, and illegal entrants apprehended at the border; 2) individuals convicted of significant or multiple misdemeanors, or individuals apprehended in the U.S. interior who unlawfully entered or re-entered this country and have not been continuously physically present in the United States since January 1, 2014, or individuals who have significantly abused the visa or visa waiver programs; and 3) individuals who have failed to abide by a final order of removal issued on or after January 1, 2014. ICE may also continue to remove individuals not falling within the aforementioned categories if their removal would serve an important federal interest. Training on the revised November 2014 priorities occurred shortly after publication, culminating in implementation in January 2015.
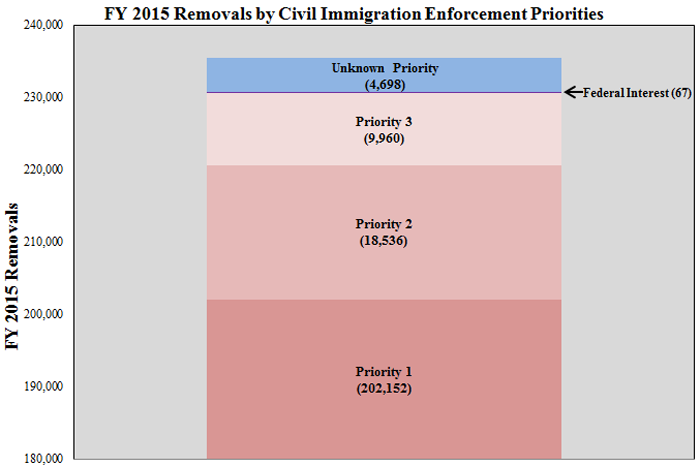
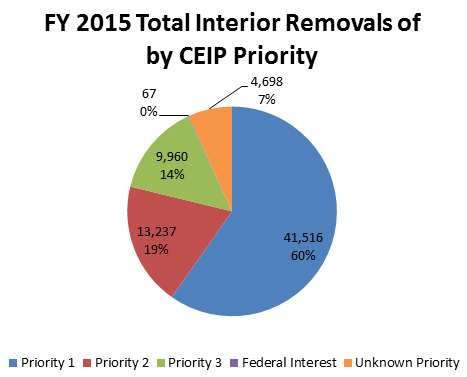
Although these revised enforcement priorities were only in effect for the final three quarters of FY 2015, ICE’s FY 2015 removal statistics in Table 1 below, broken out by CIEP Priority Status, demonstrates strong alignment to these revised priorities. With respect to overall ICE removals in FY 2015, 98 percent were individuals that were a CIEP priority and 86 percent were CIEP Priority 1 individuals.
| Priority 1 | Priority 2 | Priority 3 | Federal Interest | Total with a CIEP Priority | Unknown Priority | Total |
|---|---|---|---|---|---|---|
| 202,152 | 18,536 | 9,960 | 67 | 230,715 | 4,698 | 235,413 |
| 86% | 8% | 4% | < 1% | 98% | 2% | 100% |
Focus
Focus on Convicted Criminal Aliens
ICE has continued to increase its focus on identifying, arresting, and removing convicted criminals in prisons and jails, and also at-large arrests in the interior.8 In FY 2015, ICE sustained the improved quality of its removals by focusing on serious public safety and national security threats. ICE increased the percentage of removals of convicted criminal by 3 percent over FY 2014. In FY 2015, ICE removed 139,368 convicted criminals, which represented 59 percent of total ICE removals.
In FY 2015, under the new CIEP framework (Table 2), 98 percent of all removals of convicted criminals fell into one of the revised enforcement priorities and 81 percent of removals of convicted criminals were ICE’s highest priority, CIEP Priority 1.9
| CIEP Priority | Convicted Criminal Removals | % of Total Convicted Criminal Removals |
|---|---|---|
| Priority 1 | 113,385 | 81% |
| Priority 2 | 14,869 | 11% |
| Priority 3 | 7,770 | 6% |
| Federal Interest | 32 | 0% |
| Unknown Priority | 3,312 | 2% |
| Total | 139,368 | 100% |
This strong alignment with the CIEP Priorities, shown in Figure 3, exemplifies ICE’s continued focus on targeted enforcement.
Figure 3
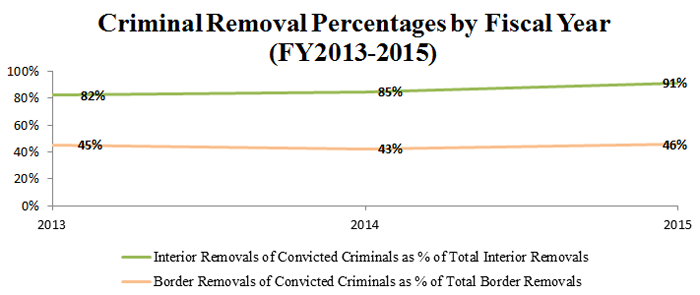
In addition to the increase in the percentage of ICE removals that were of convicted criminals, ERO’s interior enforcement activities led to an increase in the percentage of ICE’s interior removals (i.e., individuals apprehended by ICE officers and agents in the interior) that were of convicted criminals. This percentage grew from 82 percent in FY 2013 to 91 percent in FY 2015, as shown in Figure 4.
Figure 4
There were 69,478 interior removals in FY 2015, with 93 percent of those removals falling into one of the CIEP priorities, as shown in Figure 5. This further demonstrates ICE’s focus on smarter, public safety-oriented enforcement.
Figure 5
8 Federal court rulings, such as Rodriguez v. Robbins, 715 F.3d 1127 (9th Cir. 2013), continued to challenge ICE’s interior operations. Rodriguez applies throughout the Ninth Circuit, the federal court jurisdiction with the largest number of individuals in removal proceedings. It allows individuals who previously would have been detained without bond, to seek release on bonds from immigration judges. Their cases are then transferred from the relatively expedited detained court docket to the slower non-detained court docket, thereby decreasing the number of overall removals in a given year. | return to text
9 The remaining 2 percent of convicted criminal removals who fell under Unknown Priority cannot be statistically reported under the new CIEP priorities. Unknown Priority is a reflection of those cases in which a priority has not been assigned. Most of these cases with unknown priority reflect cases that were processed before CIEP was implemented (i.e., Prior to January 2015); the rest simply did not have the priority data flags or other supporting data to definitively support statistical reporting. | return to text
Removals
Non-Criminal Removals
Most ICE removals of non-criminal immigration violators were individuals encountered by CBP agents and officers at or near the border or ports of entry. For example, 94 percent (90,103) of ICE’s 96,045 removals of non-criminal immigration violators in FY 2015 were individuals apprehended at or near the border or ports of entry. Approximately 98 percent of all ICE removals of non-criminal immigration violators met one of ICE’s stated enforcement priorities, and 92 percent of all ICE removals of non-criminal immigration violators met CIEP Priority 1.
Removed Population by Citizenship
In FY 2015, ICE removed individuals to 181 countries, the top 10 of which are provided in Table 3.10 Mexico continued to be the leading country of origin for those removed, followed by Guatemala, El Salvador, and Honduras. As a percentage of total removals, Mexican removals increased from 56 percent in FY 2014 to 62 percent in FY 2015. El Salvadoran removals remained constant at 9 percent of total removals. Guatemalan removals decreased to 14 percent in FY 2015 from 17 percent in FY 2014, and Honduran removals decreased to 9 percent from 13 percent.
| Citizenship | Total |
|---|---|
| Mexico | 146,132 |
| Guatemala | 33,249 |
| El Salvador | 21,920 |
| Honduras | 20,309 |
| Dominican Republic | 1,946 |
| Ecuador | 1,305 |
| Colombia | 1,154 |
| Nicaragua | 867 |
| Brazil | 744 |
| Jamaica | 738 |
| Other | 7,049 |
| Total | 235,413 |
| Citizenship | Total |
|---|---|
| Mexico | 146,132 |
| Guatemala | 33,249 |
| El Salvador | 21,920 |
| Honduras | 20,309 |
| Dominican Republic | 1,946 |
| Ecuador | 1,305 |
| Colombia | 1,154 |
| Nicaragua | 867 |
| Brazil | 744 |
| Jamaica | 738 |
| Peru | 482 |
| Haiti | 433 |
| Canada | 407 |
| China, People’s Republic of | 386 |
| India | 311 |
| Nigeria | 224 |
| Philippines | 196 |
| United Kingdom | 166 |
| Costa Rica | 162 |
| Venezuela | 134 |
| Spain | 131 |
| Romania | 130 |
| Poland | 124 |
| Trinidad and Tobago | 123 |
| Belize | 121 |
| Somalia | 120 |
| South Korea | 105 |
| Guyana | 104 |
| Kenya | 104 |
| Italy | 89 |
| Panama | 87 |
| Saudi Arabia | 85 |
| Argentina | 82 |
| Pakistan | 80 |
| Bahamas | 78 |
| Russia | 77 |
| Ukraine | 74 |
| Micronesia, Federated States of | 70 |
| Bolivia | 67 |
| Israel | 66 |
| Jordan | 66 |
| Ghana | 65 |
| Germany | 57 |
| Chile | 56 |
| Egypt | 56 |
| Bangladesh | 55 |
| Turkey | 55 |
| France | 49 |
| Bosnia-Herzegovina | 47 |
| Portugal | 47 |
| Indonesia | 45 |
| South Korea | 43 |
| Netherlands | 43 |
| Albania | 42 |
| Cuba | 42 |
| Ethiopia | 37 |
| Hungary | 37 |
| Iraq | 36 |
| Lebanon | 36 |
| Thailand | 35 |
| Bulgaria | 32 |
| Vietnam | 32 |
| Latvia | 31 |
| Australia | 30 |
| South Africa | 30 |
| Japan | 29 |
| Cameroon | 28 |
| Czech Republic | 27 |
| Sri Lanka | 27 |
| Unknown | 26 |
| Uruguay | 26 |
| Morocco | 25 |
| Tanzania | 25 |
| Taiwan | 24 |
| Marshall Islands | 23 |
| Nepal | 23 |
| Armenia | 21 |
| Iran | 21 |
| Ireland | 21 |
| Uzbekistan | 21 |
| Lithuania | 19 |
| New Zealand | 19 |
| Senegal | 18 |
| Afghanistan | 17 |
| Cambodia | 16 |
| Moldova | 16 |
| Sweden | 16 |
| Tonga | 16 |
| Yemen | 16 |
| Antigua-Barbuda | 15 |
| Dominica | 15 |
| St. Kitts-Nevis | 15 |
| Tunisia | 14 |
| Georgia | 13 |
| Mongolia | 13 |
| Barbados | 12 |
| Burkina Faso | 12 |
| Greece | 12 |
| Zambia | 12 |
| Kazakhstan | 11 |
| Malaysia | 11 |
| Palau | 11 |
| Paraguay | 11 |
| Uganda | 11 |
| Angola | 10 |
| Austria | 10 |
| Fiji | 10 |
| Grenada | 10 |
| Hong Kong | 10 |
| Kosovo | 10 |
| Slovakia | 10 |
| Yugoslavia | 10 |
| Belgium | 9 |
| Guinea | 9 |
| Ivory Coast | 9 |
| Kyrgyzstan | 9 |
| St. Vincent-Grenadines | 9 |
| Sudan | 9 |
| Zimbabwe | 9 |
| Belarus | 8 |
| Croatia | 8 |
| Dem. Rep. of the Congo | 8 |
| Gabon | 8 |
| Macedonia | 8 |
| Montenegro | 8 |
| Niger | 8 |
| Serbia | 8 |
| St. Lucia | 8 |
| Benin | 7 |
| Bermuda | 7 |
| Cape Verde | 7 |
| Denmark | 7 |
| Estonia | 7 |
| Gambia | 7 |
| Kuwait | 7 |
| Qatar | 7 |
| Tajikistan | 7 |
| Togo | 7 |
| Eritrea | 6 |
| Liberia | 6 |
| Mali | 6 |
| Rwanda | 6 |
| Singapore | 6 |
| Switzerland | 6 |
| Algeria | 5 |
| Azerbaijan | 5 |
| Burma | 5 |
| Congo | 5 |
| Suriname | 5 |
| Syria | 5 |
| Turkmenistan | 5 |
| Mauritania | 4 |
| Netherlands Antilles | 4 |
| Norway | 4 |
| Slovenia | 4 |
| Czechoslovakia | 3 |
| Iceland | 3 |
| Laos | 3 |
| Libya | 3 |
| Sierra Leone | 3 |
| United Arab Emirates | 3 |
| British Virgin Islands | 2 |
| Chad | 2 |
| Finland | 2 |
| Malawi | 2 |
| Malta | 2 |
| Samoa | 2 |
| Serbia and Montenegro | 2 |
| Swaziland | 2 |
| Turks and Caicos Islands | 2 |
| Botswana | 1 |
| Burundi | 1 |
| Cayman Islands | 1 |
| Djibouti | 1 |
| Equatorial Guinea | 1 |
| French Polynesia | 1 |
| Guadeloupe | 1 |
| Mauritius | 1 |
| Namibia | 1 |
| Sao Tome and Principe | 1 |
| South Sudan | 1 |
| Total | 235,413 |
10 Details for all 181 removals are provided in Table 4. | return to text
Partners
Level of Cooperation from State and Local Law Enforcement Partners
The enactment of numerous state statutes and local ordinances reducing and/or preventing cooperation with ICE, in addition to federal court decisions which created liability concerns for cooperating law enforcement agencies, led an increasing number of jurisdictions to decline to honor immigration detainers in FY 2015. From January 2014, when ICE began tracking declinations of immigration detainers through June 2015 (before the July 2015 implementation of PEP), state and local law enforcement agencies declined 16,495 immigration detainers, resulting in convicted criminals being released back into U.S. communities with the potential to re-offend, notwithstanding ICE’s request for those individuals. Moreover, these releases further constrained ICE’s civil immigration enforcement efforts because it required ICE to expend additional resources to locate and arrest convicted criminals who were at-large rather than transferred directly from jails into ICE custody, drawing resources away from other ICE enforcement efforts.
In July 2015, ICE implemented PEP and began using revised forms, the I-247D detainer form and the I-247N, a request for notification form. Each of the 24 ICE field office directors, whose areas of responsibility includes at least one location that does not honor detainers, are in ongoing discussions with their law enforcement partners in order to tailor PEP in each location to best meet the communities’ needs.
Additionally, to facilitate state and local cooperation, Secretary Johnson, Deputy Secretary Mayorkas, and Director Saldaña have met with elected and law enforcement officials in some of our largest jurisdictions, including Los Angeles, New York City, and Florida. DHS and ICE officials also regularly engage with senior law enforcement officials from across the nation through various associations and task forces. This robust engagement is producing results. Counties like Los Angeles, Alameda, San Diego, Fresno, San Mateo, Sonoma, and Monterey in California are now working with ICE through PEP. Today, many law enforcement agencies, including previously uncooperative jurisdictions, are now cooperating with ICE through PEP.
Apprehensions
Decreased Illegal Migration and CBP Apprehensions
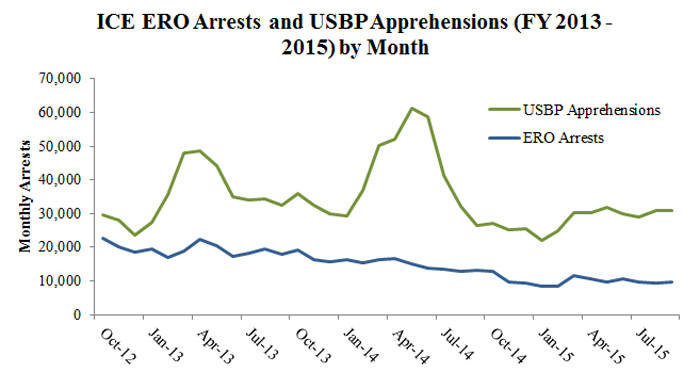
ICE supports border security efforts by detaining and removing certain individuals arrested by CBP at the border and elsewhere. Historically, a significant amount of ICE’s removals have been based on CBP’s significant border apprehensions. However, with the exception of 1 year, apprehensions – a key measure of illegal border crossings – along the southwest border are at their lowest level in more than 40 years. In FY 2015, the total number of U.S. Border Patrol apprehensions was approximately 337,117, a decrease of 30 percent from FY 2014 as shown in Figure 6. This in turn resulted in a decrease of overall FY 2015 ICE intakes based upon those CBP apprehensions, falling 26 percent from 263,340 intakes in FY 2014 to 193,951 intakes in FY 2015.
Figure 6
Demographics
Changing Migrant Demographics
Changing migrant demographics also impacted ICE removal operations, as illegal entries by Mexicans continued to decrease while those by Central Americans continued to increase. More time, personnel resources, and funding are required to complete the removal process for nationals from Central America and other non-contiguous countries as compared to Mexican nationals apprehended at the border. This is because removals of non-Mexican nationals require ICE to use additional detention capacity, more time and effort to secure travel documents from the host country, and to arrange air transportation to remove the individual to the home country. Additionally, many Central American nationals are asserting claims of credible or reasonable fear of persecution. Such cases require a careful adjudication and, therefore, take longer to process.
Methodology
Data Source
Data used to report ICE statistics are obtained through the ICE Integrated Decision Support (IIDS) system data warehouse.
Data Run Dates
- FY 2015: IIDSv1.19 run date 10/04/2015; ENFORCE Integrated Database (EID) as of 10/02/2015
- FY 2014: IIDS v1.16 run date 10/05/2014; EID as of 10/03/2014
- FY 2013: IIDS v1.14 run date 10/06/2013; EID as of 10/04/2013
- FY 2012: IIDS v1.12 run date 10/07/2012; EID as of 10/05/2012
- FY 2011: IIDS run date 10/07/2011; EID as of 10/05/2011
- FY 2010: IIDS run date 10/05/2010; EID as of 10/03/2010
- FY 2009: Removals and returns are an adjusted historical number of an IIDS run date of 08/16/2010 (EID as of 08/14/2010) and will remain static.
Removals
Removals data are historical and remain static; removals include returns. Returns include voluntary returns, voluntary departures, and withdrawals under docket control.
In FY 2009, ICE began to “lock” removal statistics on October 5 at the end of each fiscal year and counted only aliens whose removal or return was already confirmed. Aliens removed or returned in that fiscal year but not confirmed until after October 5 were excluded from the locked data, and thus from ICE statistics. To ensure an accurate and complete representation of all removals and returns, ICE will count removals and returns confirmed after October 5 toward the next fiscal year. FY 2012 removals, excluding FY 2011 “lag,” were 402,919. FY 2013 removals, excluding FY 2012 “lag,” were 363,144.
FY Data Lag/Case Closure Lag is defined as the physical removal of an alien occurring in a given month; however, the case is not closed in EARM until the fiscal year after the data is locked. Since data from the previous fiscal years are locked, the removal is recorded in the month the case was closed and reported in subsequent FY removals. This will result in a higher number of recorded removals in a fiscal year than actual departures.
Any voluntary return on or after June 1, 2013 without an ICE intake case will not be recorded as an ICE removal.
ERO removals include aliens processed for expedited removal (ER) and turned over to ERO for detention. Aliens processed for ER and not detained by ERO are primarily processed by Border Patrol. CBP should be contacted for those statistics.
FY 2012 through FY 2013 – Removals include Alien Transfer and Exit Program removals.
Criminality
Criminality is determined by the existence of a criminal conviction within the Crime Entry Screen for an individual.